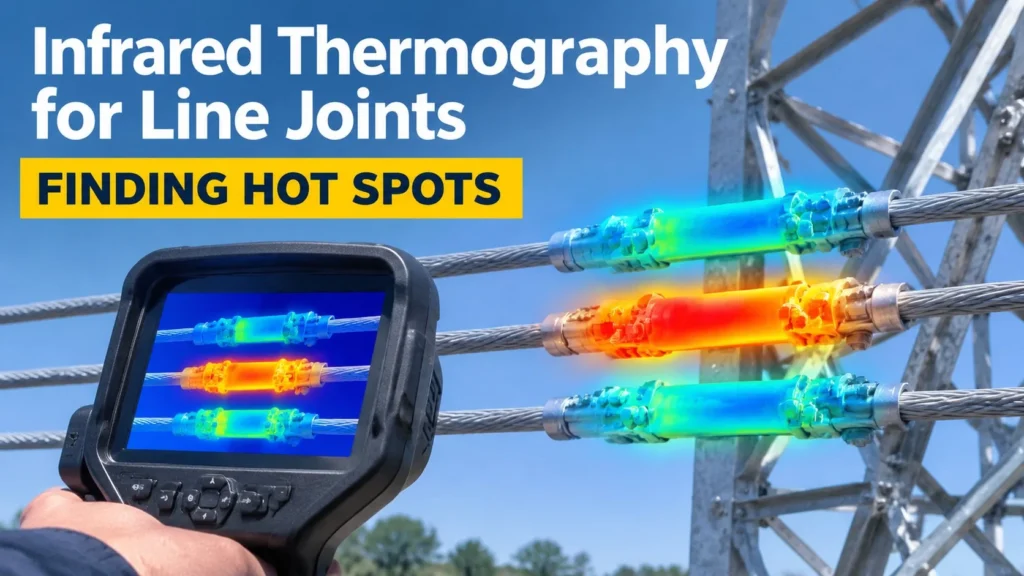
Infrared Thermography for Line Joints: Finding Hot Spots
Every joint on an overhead line — tension clamp, mid-span compression sleeve, parallel groove clamp, bolted terminal, insulation piercing tap — is an electrical connection first and a mechanical assembly second. The moment its contact resistance rises, the joint starts converting transport current into heat, and it keeps doing so quietly for months. Nothing looks different from the ground. The line carries full load, the clamp holds the conductor, and the defect only announces itself when the annealed conductor or the burnt fitting lets go.
Infrared thermography is the one routine method that finds these joints before they fail, because heat is the defect’s own signature. It does not replace the walking inspection covered in overhead line fittings inspection, which catches corrosion, loose hardware and cracked bodies; it is the complementary half that reads the condition you cannot see. What follows covers how the method works, the load and weather conditions that decide whether a scan is worth driving out for, how to set up the camera, and how to judge a reading without inventing thresholds. No temperature or delta limits appear here: those belong to your utility’s thermal survey procedure and the applicable standard, and every judgement below is framed so those documents can slot in.
What a Hot Joint Is Actually Telling You
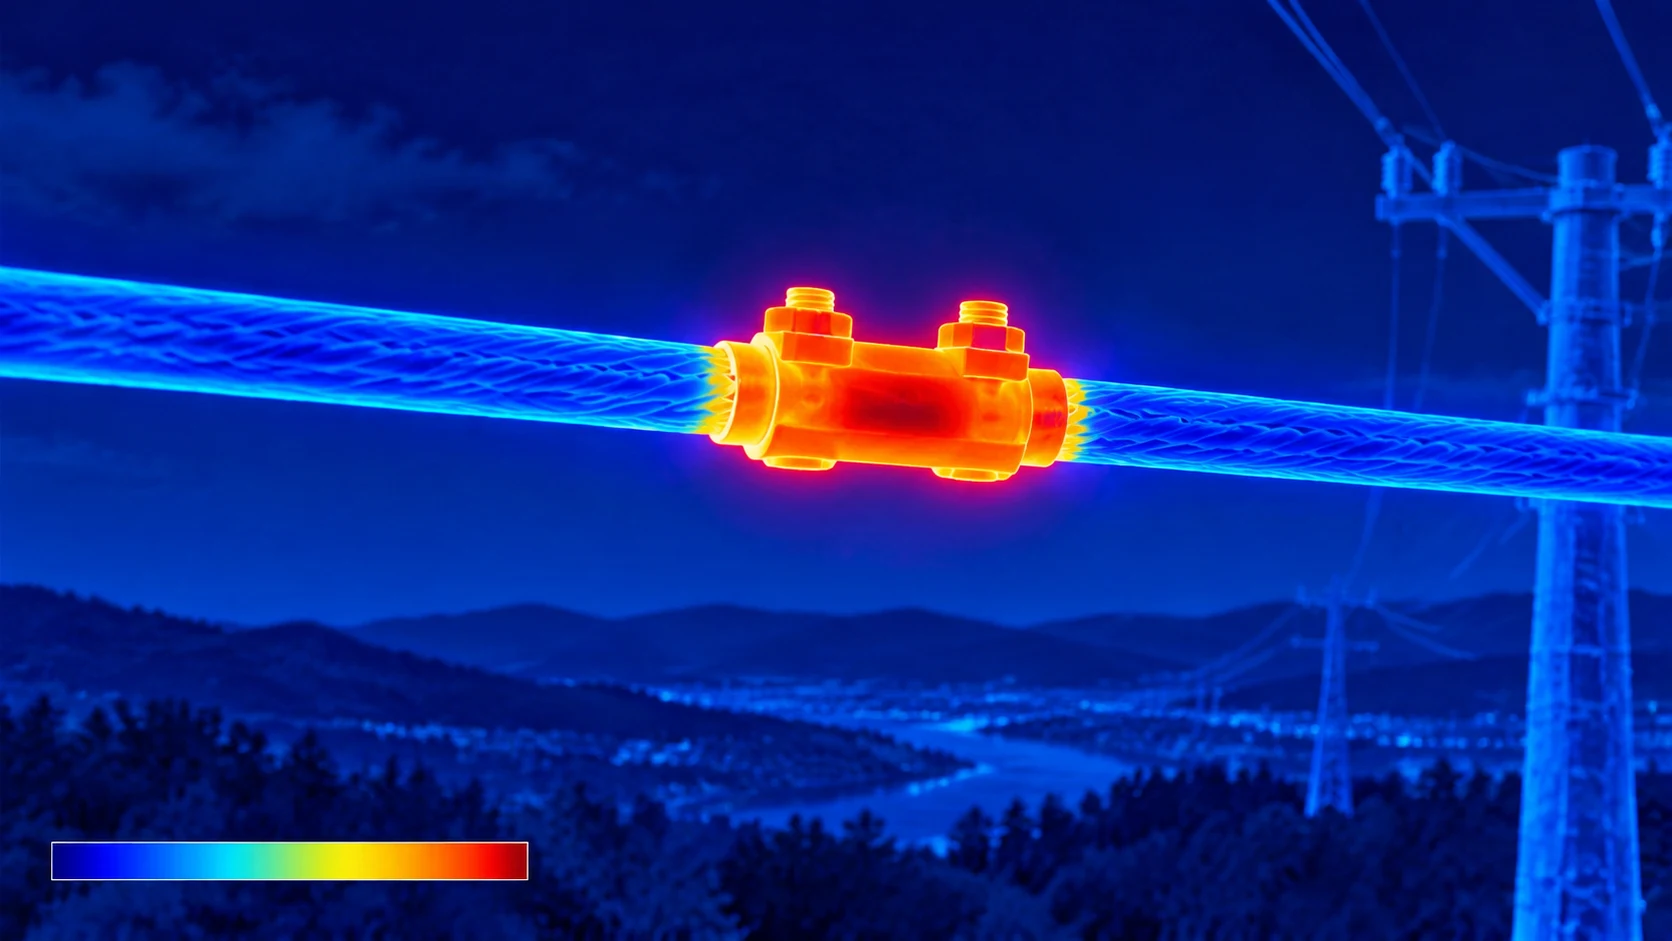
A joint carries current through a small number of real metal-to-metal contact points, not through the whole apparent interface. Conduction happens where surface films are broken through by contact pressure. If pressure relaxes — bolt creep, thermal cycling, corrosion products growing in the interface, conductor strands pulling out of a compression sleeve — the number of live contact points drops, resistance rises, and the loss in the joint climbs with the square of the current.
The heat has nowhere local to go on a conductor in free air, so it flows along the metal and radiates away. A healthy joint at the same current is often marginally cooler than the conductor itself, because aluminium and copper fittings typically conduct better than the stranded conductor. A joint that is warmer than the conductor on both sides is therefore already reporting a resistance several times above its as-installed value — the heat is disproportionate long before it is visible. This is why thermal scanning is a trend instrument rather than a pass-fail gauge: the reading’s value is mostly in how it changes between surveys and how it compares with its neighbours.
Two consequences follow for buyers and maintenance planners. First, the joints most worth scanning are the ones whose installation history is least trustworthy — field-bolted and field-crimped connections done under schedule pressure, and any fitting reworked after conductor damage of the kind covered in conductor repair sleeves and patches. Second, a hot joint is not necessarily a hardware defect. It may be a sound fitting installed badly, which changes the fix from replacement to re-torque, re-crimp or re-clean — and the scan cannot tell you which until someone climbs up.
How the Camera Sees a Joint
An infrared camera does not measure temperature. It measures the radiation a surface emits, and computes a temperature from it assuming the surface radiates like a body of a stated efficiency — the emissivity setting. Get that setting wrong and the number on the screen is fiction, because the relationship between radiation and temperature is steep at these wavelengths.
The complication on overhead lines is that the metals involved are poor radiators. Bright new galvanised steel, bare copper and shiny aluminium have low emissivity, which does two damaging things at once: the camera under-reads their true temperature, and the surface behaves like a mirror, reflecting the sky, the ground and the sun onto your detector. Aged, oxidised, anodised, painted or dirty surfaces radiate far more like the camera’s setting, which is why old lines scan more honestly than new ones. Most practical surveys handle this by trusting relative comparisons between similar surfaces at similar angles rather than absolute numbers.
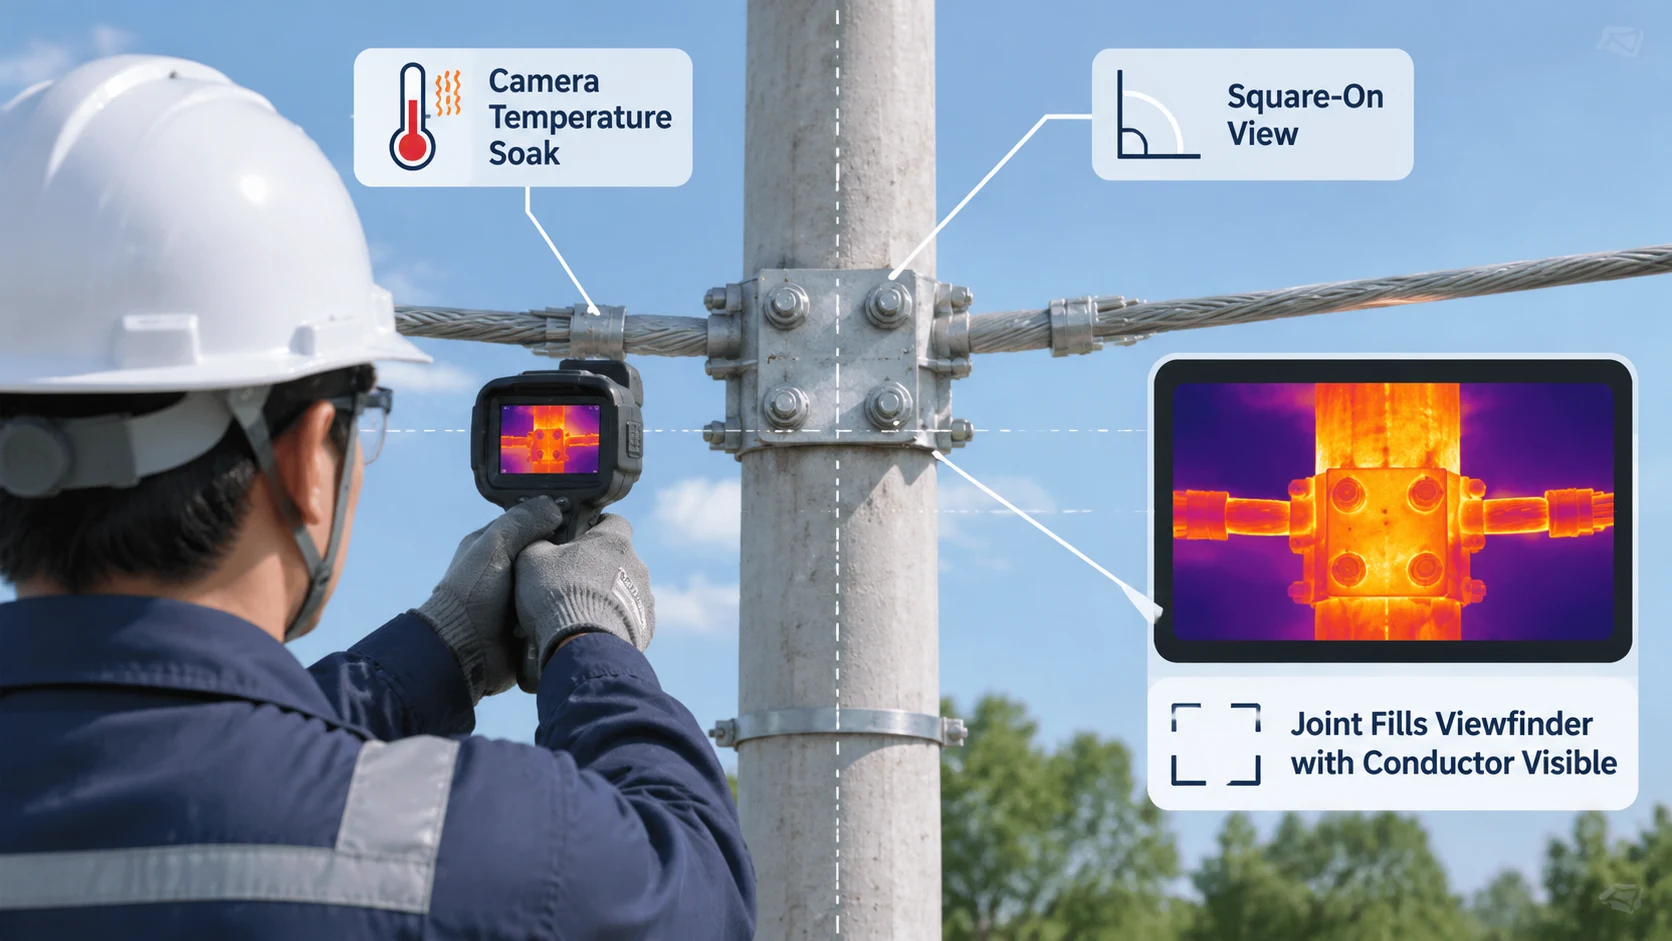
Distance and angle finish the picture. A joint at mid-span seen from below at a steep angle presents a sliver of its true area, and the camera averages that sliver with the sky behind it. From too far away, the joint occupies a handful of pixels and the reported temperature is a blend of joint, conductor and background. Closer, more square-on, and with the joint filling a decent block of pixels, the reading becomes meaningful. A productive thermal survey is therefore planned around access — roads under the line, bucket positions, structure heights — not around camera settings alone.
Conditions That Decide Whether a Scan Is Worth Doing
Thermal scanning only works when the line is doing enough work to heat its own defects. Load, wind and sun are the three gates, and a survey done at the wrong time produces a clean-looking report that is worse than no report, because it files every joint as healthy.
| Condition | Why it matters | Practical handling |
|---|---|---|
| Load on the circuit | Joint heating rises with the square of current. A lightly loaded feeder can hide a badly degraded joint because there is not enough current to warm it above the background. Absolute temperature tells you little about severity unless you also know the loading at the moment of the scan. | Plan surveys against expected peak loading, and record the loading alongside every image. A joint scanned at low load and found “cool” must be rescanned at high load before it is cleared. Treat any survey below normal daytime loading as a preliminary pass only. |
| Wind | Moving air convects heat off the joint as fast as it is generated. A gusty day flattens the contrast between good and bad joints, and does so unevenly along the line, so comparison between structures becomes unreliable. | Prefer calm days. If wind picks up during a survey, note it against the affected spans and re-scan the worst-looking joints later in calmer air. |
| Sun and time of day | Direct sun heats fittings directly, washing out electrical heating; low sun reflects off conductors and bright fittings into the lens. A line baked in afternoon sun carries thermal baggage that has nothing to do with the current. | Favour early morning or overcast conditions, when the line’s temperature is dominated by load rather than insolation. Never survey with the sun behind you at a low angle. Record sky conditions in the survey log. |
| Rain and fog | Water on surfaces evens out temperatures and attenuates the signal; wet hardware reads uniformly cool. Fog also limits working distance. | Postpone. A survey in rain is a survey of the weather, not the line. |
The commercial point behind this table: thermal surveys are cheap relative to the fault they prevent, but only if the conditions are right. A contractor who offers a fixed-price annual scan without asking about your load profile is selling images, not diagnosis. When you commission one, hand over the loading data for the scan window — the operator needs it to interpret severity, and you need it recorded to compare next year’s readings at a comparable load.
Doing the Scan: Settings, Distance, Angle
Field practice for line work settles into a short checklist. Let the camera reach outdoor ambient temperature before use — a camera carried warm from a vehicle misreads at first. The emissivity setting follows the procedure in the applicable standard or your utility’s practice; for line hardware the common approach is a single setting for aged metal surfaces, with bright new surfaces flagged as suspect. Focus matters more than people expect: an out-of-focus image mixes target and background radiation irreversibly.
Shoot each joint as square-on as access allows and close enough that the joint fills a clear block of pixels — then back off and re-shoot from the next structure or a road position, because a hot spot that appears and disappears with angle is usually a reflection, not a fault. Capture the joint together with a stretch of conductor on both sides in the same frame: the conductor on either side is the reference the reading will be judged against. Save every image with the structure number, phase and time; a thermogram without a location is decorative.
Certain joints deserve priority on any route. Bolted dead-ends, jumper connections between phases, tap points, and anything near equipment terminals run hotter duty than plain suspension points. Branch connections made with insulation piercing connectors — covered separately in the insulation piercing connector range — are tap joints with a designed contact regime, and their thermal behaviour over years is exactly what a survey tracks. Insulated ABC tap points covered in aerial bundled cable fittings need the jacket factored in: the jacket delays and smooths the surface heat, so defects there take longer to surface but still show as warm spots against neighbouring jackets.
Judging What You See: Comparing Against Something
Two reading methods coexist in line work, answering different questions. The comparative method asks “does this joint look like its neighbours?” The absolute method asks “what temperature is this joint, and what does that number mean?” The comparative method is the workhorse of ground surveys because it is self-correcting: everything that biases one reading — emissivity, angle, sun, distance — biases the neighbouring joint the same way, so the difference survives.
| Method | How it is applied | Strengths and limits |
|---|---|---|
| Comparative (same-phase, same-circuit) | Compare the joint against the conductor a short distance to each side of it, and against equivalent joints on the same phase and the parallel phases, scanned at the same time from the same position. | Self-corrects for emissivity, sun and load conditions, since all compared targets share them. Needs only one visit and no instrument calibration chain. Cannot rank severity in absolute terms, and is blind to a defect that warms every joint on a circuit equally — for example a systemic under-torque at installation. |
| Comparative (historical, same joint) | Re-shoot the same joint from the same position at similar load, and compare this year’s image with last year’s. | The strongest single signal in the whole method. A joint that is unchanged year on year is stable even if it runs warm; a joint whose contrast is growing is heading somewhere regardless of its absolute number. Demands disciplined record-keeping and repeatable shot positions. |
| Absolute (measured temperature and rise) | Read the joint temperature and its rise over conductor or ambient, then classify against the thresholds given in the utility’s thermal procedure or the applicable standard. | Gives a defensible priority ranking and fits work-order systems. Fully exposed to every measurement error: wrong emissivity, reflection, wind, low load all move the number. Only as good as the conditions and instrument discipline behind it. |
In practice a survey runs comparative in the field and absolute at the desk. The operator flags anything that stands out from its neighbours; back at the office, the flagged set gets temperature readings, load data and the procedure’s classification, and comes out as a ranked repair list. What neither method can do is convert a single image into a remaining-life estimate. A hot joint is a call for closer inspection, not a countdown clock.
False Positives and False Negatives
Reflection is the leading false positive. Sky and sun reflected off a bright galvanised or new aluminium surface can make a healthy joint look dramatically hot, and the effect moves as the operator moves — which is why the two-angle re-shoot is in the checklist. Sun-heated hardware is the second: a fitting on the sunny side of a structure late in the afternoon can out-warm a genuinely defective joint on the shaded side, and the two are distinguishable only by scanning when the sun is not doing the heating. A third is background: a joint framed against a warm transformer, wall or sunlit ground picks up apparent temperature that is not its own.
False negatives are quieter and cost more. Low load hides joints, as the conditions table makes clear. Wind flattens contrast just enough to demote a borderline joint from “flag” to “within normal”. And insulated or jacketed joints lag: the heat from a degrading contact has to conduct through insulation before the camera sees it, so a first-year cool reading on a jacketed tap is weaker evidence than the same reading on a bare bolted joint. The strongest safeguard is pairing the thermal pass with the visual regime in the inspection article and with the failure signatures described in suspension clamp failure causes and field checks, so mechanical evidence can corroborate a lukewarm thermal verdict.
One more trap: do not compare joints across different load conditions and treat the difference as degradation. Two structures scanned an hour apart on a circuit whose load has shifted are not comparable, and the honest report notes the load at each shot.
From Hot Spot to Work Order
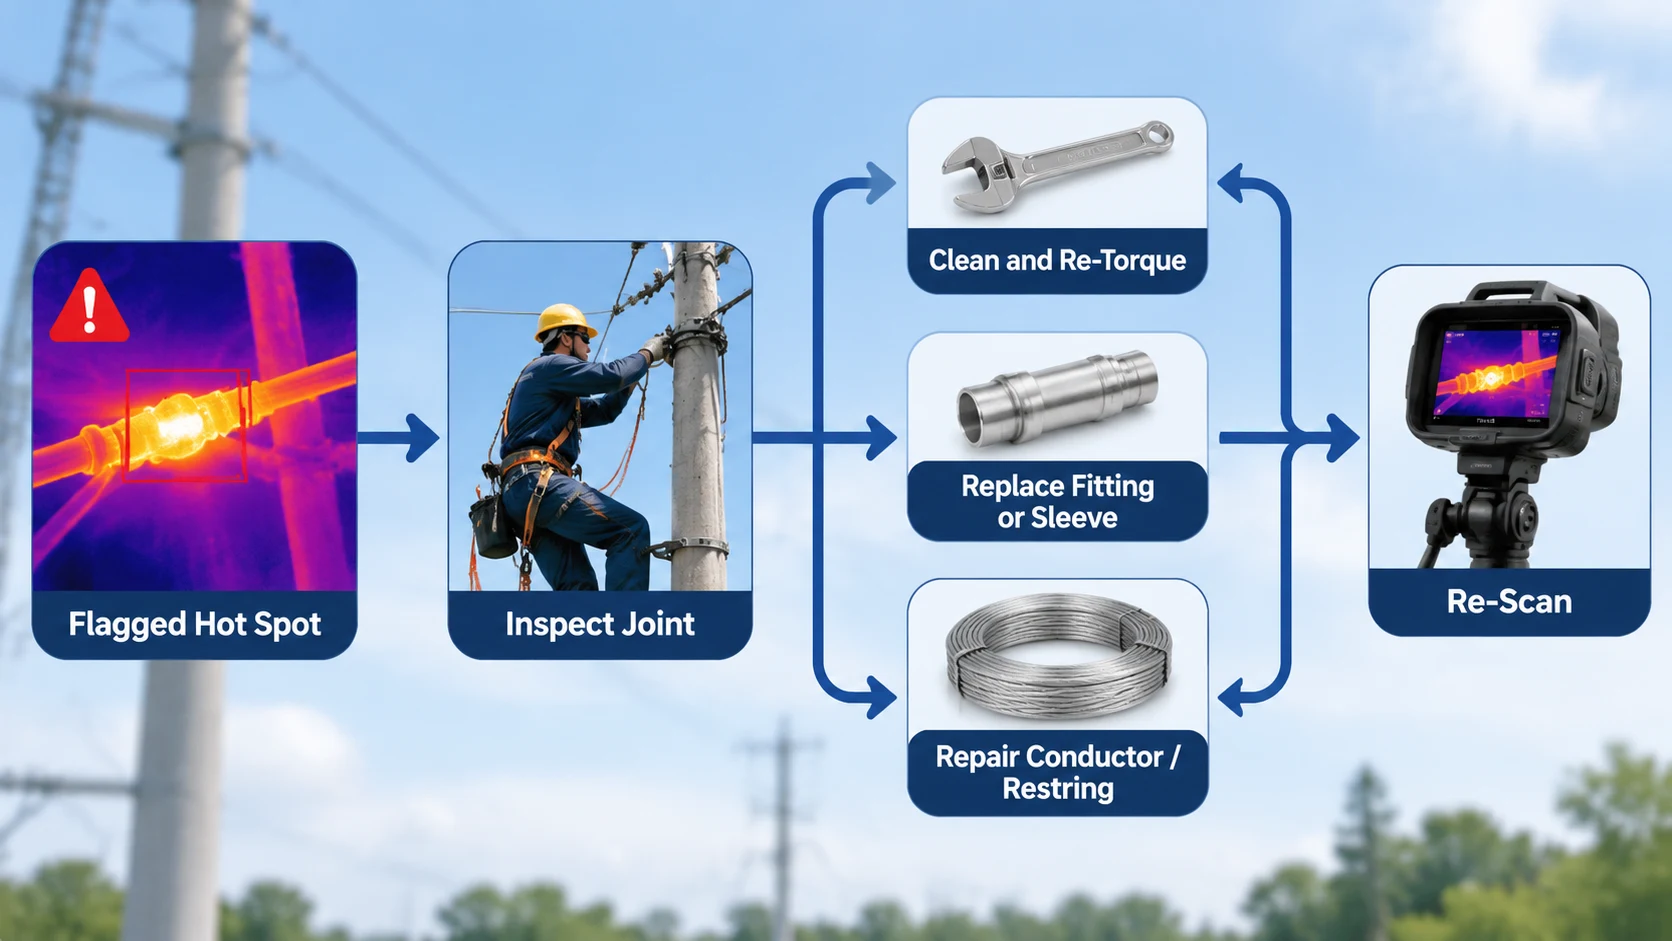
A flagged joint needs a ground-truth visit, and the fix depends on what the climb finds. If the fitting is sound but the contact has relaxed — the commonest case for bolted joints — the fix is to disassemble, clean the contact interfaces, reassemble and torque to the value in the fitting’s own specification, following the fitting-specific practice in the tension clamp installation guide or the suspension clamp installation guide. Torquing “tight” without disassembly is a coin toss: corrosion products in the interface stay put, and the joint reads cool for a month before heating again.
If the contact surfaces are burnt, annealed or materially eroded, or a compression sleeve has slipped, the fitting or sleeve is replaced — and if the conductor itself has annealed over a long hot history, the repair extends into the conductor, which is a restring decision. A joint that repeatedly reheats after correct re-work points to something upstream: wrong fitting selection for the conductor, wrong crimp die, or a conductor-fitting mismatch of the sort the selection tables in tension clamp types compared exist to prevent. Every repaired joint goes back on the scan list for the next two surveys: re-scan on the first high-load window after repair, then again at the next cycle.
For cable-side joints the same ladder applies with different hardware. Terminations at equipment and panel ends fail in ways that track the crimp and terminal practices in the cable lug crimping guide, and a lug that reads warm at the barrel rather than the palm is telling you the crimp is the suspect, not the bolt. New fittings also benefit from the receiving checks in incoming inspection of line hardware, which catches the plating and dimensional defects that later masquerade as installation problems on a thermogram.
Records That Make the Next Survey Cheap
The first thermal survey of a line produces a baseline and little else, because there is nothing to compare against. The second survey is where the method starts paying: unchanged joints get cleared quickly, changed joints surface early, and the field crew walks fewer structures. Everything that makes the second survey comparable is a record kept on the first: structure number, phase, joint type, load at time of shot, camera position, weather, and the image itself. Storing images against structure identifiers — not in a camera roll — is what turns a folder of thermograms into an asset condition database.
Three habits keep the record honest. Fix the shot positions so year-on-year images frame the same joint from the same angle. Record load conditions with every image, since a “no change” verdict between two surveys at very different loads is not a verdict at all. And when a joint is repaired, close the loop in the same record: what was found on the climb, what was done, and the date — so the next survey knows the joint in front of it is young. Utilities that keep these records end up scheduling repairs by priority instead of by outage convenience, and the same records are the evidence base when a line’s hardware is due for specification review and the procurement team starts an RFQ along the lines of how to specify overhead line fittings in an RFQ.
Frequently Asked Questions
How often should a line be thermally scanned?
Set the interval against the circuit’s loading and joint population. Critical feeders, heavily loaded lines and circuits with a history of joint failures justify a shorter cycle; lightly loaded rural spurs can run longer. Whatever interval you choose, keep it consistent — the method’s strength is the year-on-year comparison, and that only works if the surveys keep coming. Use the interval in your own maintenance policy or the applicable standard as the anchor.
Can a thermal camera find a bad joint on a new line that has just been energised?
Only if the line is carrying meaningful load, and only with humility. New fittings are bright and reflective — the worst surface for the method — and there is no baseline to compare against. A first scan after a few weeks of full-load operation is still worth doing, because systematic under-torque shows up as uniformly warm joints, but the definitive early check for new hardware is the visual and dimensional regime at commissioning, not the camera.
Do I need an expensive cooled camera for line work?
The camera matters less than the procedure. A maintained, calibrated instrument of the class your procedure requires, used at sensible distance with clean technique, will find line-joint hot spots; a better detector mainly buys working distance and finer resolution. Calibrated matters more than premium — an instrument with a current calibration certificate beats a superior detector used casually. Follow your utility’s instrument requirements for the survey class being performed.
The scan found a warm joint but the crew says it has always looked like that. Now what?
Check the record. If last year’s image from the same position at similar load shows the same warmth, the joint is stable and goes on the watch list, not the repair list. If no previous image exists or the load conditions differ, re-scan on a high-load calm day before spending a climb. “Has always looked like that” without an image is a guess, and the point of the method is to replace guesses with comparable evidence.
Are insulated and covered joints scanned the same way as bare ones?
Scanned the same way, judged differently. The jacket or insulation delays and spreads the heat reaching the surface, so a covered joint reads lower and later than a bare joint with the same internal defect. Compare covered joints against neighbouring covered joints on the same run, and weight the visual and physical checks more heavily for them — discolouration, tracking marks and deformation of the cover often carry the evidence the thermogram understates.
If you are planning a thermal survey programme and expect it to end with replacement fittings, specify them before the repair list lands: the joint types on your line determine what you order, and a supplier who can map each flagged location to a fitting with the right conductor range and strength class turns a stack of thermograms into a short procurement exercise. Send the conductor types, joint inventory and flagged structure list when you enquire through the tension clamp or suspension clamp pages, and the specification comes back checked against your actual line.